Why should you be benchmarking?
Generally, independent schools do not consider profit as their highest priority but there are a number of good reasons to benchmark financial KPIs. Non-financial KPIs should also be monitored to ensure that the School remains a relevant educational facility and is aware of the trends happening around them. The best Schools manage that equilibrium between achieving good financial and academic results as well as maintaining their state of the art facilities and attracting the best educators. Benchmarking against those who have achieved this equilibrium can go a long way to determining areas that may need attention or declining trends within a School when the competition is moving in a different direction.

The practice of benchmarking key performance indicators (KPIs) is not new, yet it is one of the most under-utilised management tools. Benchmarking provides management and the board essential comparative information on their organisation’s performance compared to others in the same industry. Research has determined that organisations whose best practice performance measures rank in the top quartile of their industry are 10 times more profitable than those that rank in the bottom quartile.
Every year, we gather data during our audits of independent schools in Victoria and present it to their respective boards, so that they can see how their school compares to others. Regardless of the size of the school, meaningful comparisons can be made and valuable information can be shared with the boards on what they are doing well and what can be improved.
What does this year’s data tell us?
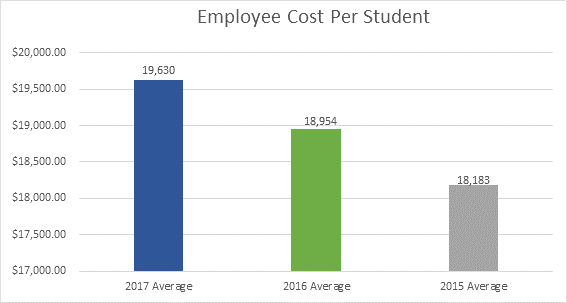
Employee cost per student
Employee costs per student were up for most schools from 2016 to 2017 with most schools being up by between 3% and 5%. A few of the schools had a decline in this ratio largely from increasing student numbers without the need to add to staffing numbers. For a lot of schools this is one of the most important ratios when it comes to the financial success of the school.
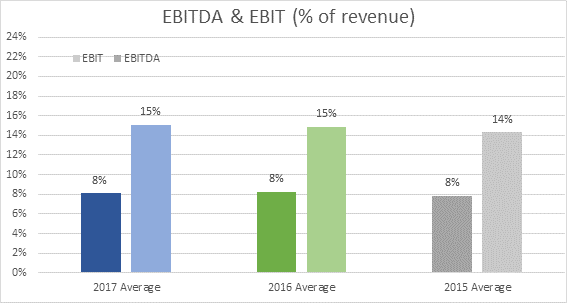
EBIT and EBITDA
EBIT (Earnings Before Interest and Tax) and EBITDA (Earnings Before Interest, Tax, Depreciation and Amortisation) have steadily declined over the last few years as the increases in costs have outweighed increases in government funding and tuition fee increases. Schools with a high EBITDA (27%-28%) included both larger and smaller schools proving once again that the number of students and level of revenue are not the only factors in determining the bottom line. These schools were typically more financially focussed, but also had other means of deriving income i.e. rental of facilities, donations, investment income.
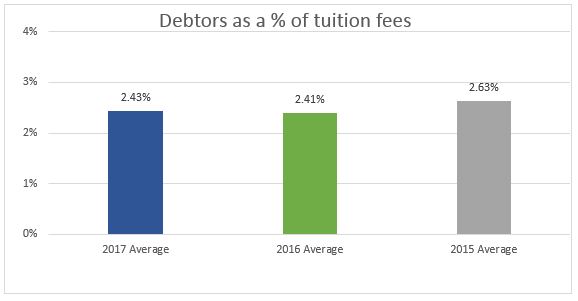
Debtors as a percentage of tuition fees
Whilst debtors are still generally not a significant amount relative to other assets for a school, it continues to be an area of focus for collectability and schools vary in the way that a term’s fees will be billed and collected. Some schools bill in advance and allow parents a bit more flexibility with payment, whereas others prefer to bill monthly to parents’ credit cards. At an average of 2.43% schools clearly regard this as an important area to stay on top of and the schools in this benchmarking study do this very well.
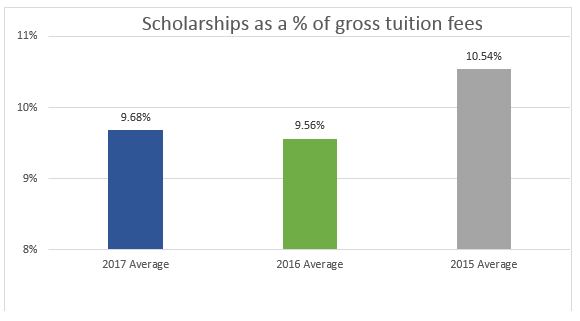
Scholarships as a percentage of tuition fees
In recent years the ratio of scholarships to tuition fees has become more and more important.
As explained in ‘Offering Tuition Fees‘, schools offer scholarships for academic and sporting success but financially there is a fine balance to be obtained between adding non-fee paying or part-fee paying students and having to add more teachers. There are also other factors that go into deciding how many scholarships to offer including collectability and how the scholarships arrangements are agreed on historically. Over the last few years this ratio has decreased as schools find this balance between academic and sporting success and financial success.
The above graphs are just a small selection of those presented to our Schools each year.
If you are the Business Manager of a school or are involved in its finances in some way, are you currently looking at your school’s financial KPI’s and comparing it to the industry benchmarks? Are you aware of what other schools are doing to improve their financial results? If you would like to know how your school compares or discuss areas of your school’s business, please don’t hesitate to contact one of our Audit Specialists, complete your details below and we’ll be in touch or give us a call on 03 9835 8200.